What the projection shows
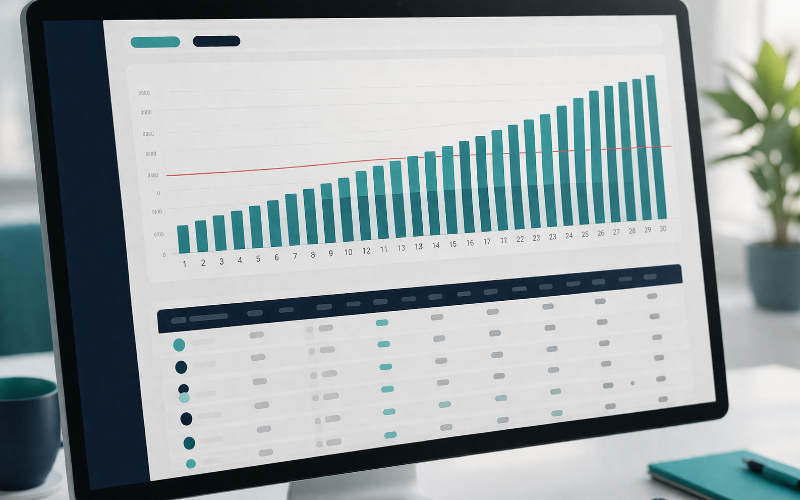
A reserve funding projection answers a simple question: will there be enough money in the reserve fund each time something needs replacing? ReservePath answers it one year at a time. For every year of the study it shows:
- Opening balance, carried from the year before.
- Contribution, with the yearly increase you set.
- Interest earned on the balance.
- Expenditures, component by component, at the inflated cost for that year.
- Closing balance.
- Fully funded balance and percent funded for that year.
The projection is built from the study's own component list. Each component carries a quantity, a unit cost, a useful life and a remaining life. ReservePath schedules each replacement when the remaining life runs out and again every useful-life years after that.
The assumptions you control
Every study has its own financial settings, so two studies for the same association can test different assumptions without touching each other:
- Starting reserve balance and annual contribution.
- Contribution increase per year.
- Inflation rate applied to replacement costs.
- Interest rate earned on the reserve balance.
- The minimum percent funded the plan should hold.
Each field has a plain-language explanation next to it. A board member does not need to know the vocabulary to follow what a setting does.
Funding scenarios side by side
Boards rarely accept the first number. ReservePath lets a preparer hold several funding scenarios on one study. It can generate the three common funding goals for you, baseline, threshold and full funding, and you can add your own, including scenarios with a special assessment paid as a lump sum or in installments.
Scenarios are compared in one table and can be marked as recommended. The recommended scenario is the one the report presents as the plan.
Tools for the conversation with the board
- Interactive funding calculator. Move the contribution, increase, inflation and interest and watch the chart redraw.
- Special assessment calculator. Model a lump sum or installments and see the effect per unit.
- Per-unit breakdown. Show what the plan means for each owner each month.
- Funding ratings. Funding level is shown as Strong, Fair or Weak using the common 30% and 70% bands, alongside a special assessment risk rating.
Numbers that agree everywhere
The same figure appears on the study screen, in the charts, in the board summary and in the full PDF report. ReservePath calculates each one in a single place and reuses it, so the percent funded on the dashboard is the percent funded in the report.
Projections are saved with the study. An approved study keeps the numbers it was approved with, even if the association's live component records change later.
Keeping the plan current
When the next cycle comes round, a study can be duplicated or rolled forward. Rolling forward ages every component, applies inflation to costs, and gives you a new starting point for an update instead of a blank page.
Who uses it
Reserve specialists use projections to build and defend the funding plan in a study. Boards and managers use them to see what a contribution change does before they vote on a budget.
Frequently asked questions
How many years does ReservePath project?
Thirty years by default, which is the usual minimum for a reserve study. The projection length is a setting on each study.
How is percent funded calculated for future years?
For each year, ReservePath inflates every component's cost to that year, multiplies it by the share of its useful life used by then, and adds the results to get that year's fully funded balance. Percent funded is the projected balance divided by that figure. A component's age resets to zero in the year it is replaced.
Can I compare funding strategies?
Yes. Each study can hold several scenarios, including baseline, threshold and full funding, plus custom ones with special assessments. They appear side by side on screen and in the report.
Does the first row of the projection include a contribution?
No. The first row is the study year, which is the opening position: the starting balance with no contribution, interest or expenses. The first full year of activity is the row after it. Reports label it so readers are not confused.
Can I export the projection?
Yes. Projections, scenarios and expenditure schedules export to CSV and to printable views, and they appear in the PDF reserve study report.
Try it on your own association
30-day free trial with full access. No card needed.
Start Your Free Trial See pricing